1. Introduction
Prostate cancer remains one of the most prevalent malignancies among men worldwide and continues to present significant challenges in diagnosis, monitoring, and treatment. Clinical decision-making has traditionally relied on prostate-specific antigen (PSA) as a primary biomarker for disease detection and progression assessment. While PSA is widely accessible and clinically useful, it is increasingly recognized that PSA alone provides an incomplete and, in some cases, misleading representation of the underlying tumor dynamics. PSA levels may remain low or within normal ranges even in the presence of clinically significant disease, thereby obscuring early progression and delaying intervention.
De Melo and St.Rose demonstrated that tumor progression may occur even under relatively low levels of PSA, highlighting a critical limitation of PSA-driven clinical assessment
| [1] | De Melo, P., and St. Rose, M., (2026), A Stochastic Framework for Evaluation of Prostate Cancer Progression and Treatment Dynamics, Cancer Research Journal (submitted) |
[1]
. Specifically, they showed that relying solely on observed PSA values can lead to inaccurate evaluation of disease burden, as PSA reflects only a partial and indirect manifestation of the underlying biological processes. This discrepancy is particularly evident in heterogeneous patient populations, where variations in tumor biology, treatment response, and individual physiology lead to divergent trajectories that are not adequately captured by deterministic or single-variable models. These findings underscore the need for modeling approaches that move beyond observable biomarkers and incorporate hidden or latent disease states.
Traditional modeling approaches in prostate cancer, including regression-based methods, Kaplan–Meier survival analysis, and Cox proportional hazards models, typically assume that patients with similar observed characteristics share similar risk profiles. However, such approaches fail to account for intrinsic stochasticity, unobserved heterogeneity, and temporal variability in disease progression. As a result, they often provide population-average estimates that lack the granularity required for personalized medicine. Moreover, these models do not explicitly represent the dynamic evolution of disease over time, nor do they quantify uncertainty in a probabilistic framework.
Researchers from the Allied Health Program at Norfolk State University have recently extended classical survival analysis approaches, including Kaplan–Meier estimation and Weibull parametric models, through stochastic expansion techniques. Their work demonstrated that deterministic survival curves, while effective for population-level summaries, fail to capture the variability and uncertainty inherent in individual patient trajectories. By incorporating stochastic perturbations and latent-state representations into these frameworks, they derived survival distributions that more accurately reflect heterogeneous disease progression and patient-specific risk profiles
| [2] | De Melo, P, Michele DiLella, M, Holman, T., McElveen, S., (2025) Accurate Prediction of Survival Based on Kaplan–Meier Analytics, (2025), Cancer Research Journal, 2025, Vol. 13, No. 4, pp. 173–185,
https://doi.org/10.11648/j.crj.20251304.14 |
[2]
.
In this paper, we discuss a new model for prostate cancer that incorporates both deterministic components, representing tumor growth and treatment effects, and stochastic components, capturing biological variability and uncertainty. In addition to PSA, clinically relevant variables such as Gleason grade group, disease stage, and treatment exposure are integrated into the model to enhance its interpretability and clinical relevance.
From a practical perspective, the proposed framework enables several clinically actionable outcomes. It allows for patient-specific prediction of disease trajectories, early identification of discordance between PSA levels and true disease burden, and improved risk stratification for progression and treatment response. The model can be used to simulate individual patient scenarios under different treatment strategies, thereby supporting personalized treatment planning and adaptive monitoring protocols. Furthermore, because it produces full probability distributions rather than point estimates, it provides clinicians with quantitative measures of uncertainty, which are critical for informed decision-making.
Importantly, the methodology is designed to be applicable to real-world clinical data and can be implemented in retrospective and prospective clinical studies. It can be integrated with routinely collected clinical variables and longitudinal PSA measurements, making it suitable for validation in clinical cohorts and potential incorporation into decision-support tools used in practice.
By explicitly modeling latent disease dynamics and their probabilistic evolution, the proposed framework provides a more comprehensive representation of prostate cancer progression. It enables the identification of clinically meaningful scenarios in which disease advancement occurs despite low PSA levels
| [1] | De Melo, P., and St. Rose, M., (2026), A Stochastic Framework for Evaluation of Prostate Cancer Progression and Treatment Dynamics, Cancer Research Journal (submitted) |
[1]
. It yields more robust prediction and risk stratification. Ultimately, this approach lays the foundation for advanced decision-support systems that incorporate uncertainty, heterogeneity, and latent-state reconstruction, moving toward more precise and personalized medicine in prostate cancer care. The method is a clinical decision-support tool that enhances existing tests, rather than replacing them.
By explicitly modeling latent disease dynamics and their probabilistic evolution, the proposed framework provides a more comprehensive representation of prostate cancer progression. It enables the identification of clinically meaningful scenarios in which disease advancement occurs despite low PSA levels, as observed in
| [1] | De Melo, P., and St. Rose, M., (2026), A Stochastic Framework for Evaluation of Prostate Cancer Progression and Treatment Dynamics, Cancer Research Journal (submitted) |
[1]
, and supports more robust prediction and risk stratification. Ultimately, this approach lays the foundation for advanced decision-support systems that incorporate uncertainty, heterogeneity, and latent-state reconstruction, moving toward a more precise and personalized medicine in prostate cancer care.
The findings of this study have important implications for clinical practice and policy development in prostate cancer screening. In 1994, the United States approved the Prostate-Specific Antigen (PSA) test as a screening tool for prostate cancer. It did so despite the test's inherent weakness: not being prostate cancer specific. Subsequent randomized trials yielded conflicting results as to its benefits. Medical guideline organizations are concerned that PSA screening results in the diagnosis and treatment of clinically indolent prostate cancer. Nevertheless, PSA screening is prevalent in North America and Europe with PSA screening increasing in other regions
| [3] | Ilic D, Djulbegovic M, Jung JH, Hwang EC, Zhou Q, Cleves A, Agoritsas T, Dahm P. (2018), Prostate cancer screening with prostate-specific antigen (PSA) test: a systematic review and meta-analysis. BMJ. 362: k3519.
https://doi.org/10.1136/bmj.k3519 |
[3]
.
Prostate cancer is the most common nonskin cancer in men in the US, with an estimated 299 010 new cases and 35 250 deaths in 2024. Prostate cancer is the second most common cancer in men worldwide, with 1 466 680 new cases and 396 792 deaths in 2022
. The most common type of prostate cancer is adenocarcinoma (≥99%), and the median age at diagnosis is 67 years.
More than 50% of prostate cancer risk is attributable to genetic factors; older age and Black race (annual incidence rate, 173.0 cases per 100 000 Black men vs 97.1 cases per 100 000 White men) are also strong risk factors. Recent guidelines encourage shared decision-making for prostate-specific antigen (PSA) screening. At diagnosis, approximately 75% of patients have cancer localized to the prostate, which is associated with a 5-year survival rate of nearly 100%. Based on risk stratification that incorporates life expectancy, tumor grade (Gleason score), tumor size, and PSA level, one-third of patients with localized prostate cancer are appropriate for active surveillance with serial PSA measurements, prostate biopsies, or magnetic resonance imaging, and initiation of treatment if the Gleason score or tumor stage increases
.
Approximately 1.5 million new cases of prostate cancer are diagnosed annually worldwide. Approximately 75% of patients present with cancer localized to the prostate, which is associated with a 5-year survival rate of nearly 100%. Management includes active surveillance, prostatectomy, or radiation therapy, depending on risk of progression. Approximately 10% of patients present with metastatic prostate cancer, which has a 5-year survival rate of 37%. First-line therapies for metastatic prostate cancer include androgen deprivation and novel androgen receptor pathway inhibitors, and chemotherapy for appropriate patients
| [4] | Raychaudhuri R, Lin DW, Montgomery RB. Prostate Cancer: A Review. JAMA. 2025 Apr 22; 333(16): 1433-1446.
https://doi.org/10.1001/jama.2025.0228 |
| [5] | Hurwitz MD, Harris J, Sartor O, Xiao Y, Shayegan B, Sperduto PW, Badiozamani KR, Lawton CAF, Horwitz EM, Michalski JM, Roof K, Beyer DC, Zhang Q, Sandler HM. Adjuvant radiation therapy, androgen deprivation, and docetaxel for high-risk prostate cancer postprostatectomy: Results of NRG Oncology/RTOG study 0621. Cancer. 2017 Jul 1; 123(13): 2489-2496. https://doi.org/10.1002/cncr.30620 |
[4, 5]
.
Complex genetic and epigenetic mechanisms are involved in the development and progression of prostate cancer. MicroRNAs (miRNAs) are short noncoding RNAs that regulate protein expression at the post-transcriptional level by targeting mRNAs for degradation or inhibiting protein translation. In the past two decades, the field of miRNA research has rapidly expanded, and emerging evidence has revealed miRNA dysfunction to be an important epigenetic mechanism underlying a wide range of diseases, including cancers
| [6] | Gujrati H, Ha S, Wang BD. Deregulated microRNAs Involved in Prostate Cancer Aggressiveness and Treatment Resistance Mechanisms. Cancers (Basel). 2023 Jun 10; 15(12): 3140. https://doi.org/10.3390/cancers15123140 |
[6]
.
Angiogenesis, increased glycolysis, and cellular adaptation to hypoxic microenvironment are characteristic of solid tumors, including prostate cancer. These representative features are the cornerstone of cancer biology, which are well correlated with invasion, metastasis, and lethality, as well as likely with the success of prostate cancer treatment (e.g., tumor hypoxia has been associated with resistance to chemotherapy and radiotherapy). It is well established that prostate cancer cells also metabolically depend on enhanced glucose transport and glycolysis for expansion, whereas growth is contingent with neovascularization to permit diffusion of oxygen and glucose
| [7] | Fraga A, Ribeiro R, Príncipe P, Lopes C, Medeiros R. Hypoxia and Prostate Cancer Aggressiveness: A Tale With Many Endings. Clin Genitourin Cancer. 2015 Aug; 13(4): 295-301. https://doi.org/10.1016/j.clgc.2015.03.006 |
[7]
.
Cancer aggressiveness and severity are fundamental yet distinct concepts in oncology, each describing different dimensions of disease behavior and clinical impact. Aggressiveness refers to the intrinsic biological properties of a tumor—how rapidly it grows, its capacity to invade surrounding tissues, its likelihood of metastasizing, and its ability to adapt to environmental stressors. In contrast, severity reflects the overall clinical burden of disease on the patient, incorporating factors such as tumor size, anatomical spread, systemic effects, and implications for morbidity and mortality. While aggressive tumors often lead to severe disease, the two are not synonymous; for example, a biologically aggressive tumor detected early may have low clinical severity, whereas a less aggressive tumor diagnosed at an advanced stage may present with high severity
| [8] | Bharti SK, Kakkad S, Danhier P, Wildes F, Penet MF, Krishnamachary B, Bhujwalla ZM. Hypoxia Patterns in Primary and Metastatic Prostate Cancer Environments. Neoplasia. 2019 Feb; 21(2): 239-246. https://doi.org/10.1016/j.neo.2018.12.004 |
[8]
.
At the cellular and molecular level, tumor aggressiveness is driven by features such as high proliferative capacity, genomic instability, and resistance to programmed cell death. A key hallmark is metabolic reprogramming, particularly the Warburg effect, in which cancer cells preferentially utilize glycolysis over oxidative phosphorylation even in oxygen-rich conditions. This metabolic shift supports rapid energy production and biosynthesis, enabling sustained tumor growth. Moreover, increased glycolytic activity contributes to acidification of the tumor microenvironment, promoting tissue invasion and impairing immune responses, thereby reinforcing aggressive behavior
| [9] | Alqawi O, Moghaddas M, Singh G. Effects of geldanamycin on HIF-1alpha mediated angiogenesis and invasion in prostate cancer cells. Prostate Cancer Prostatic Dis. 2006; 9(2): 126-35. https://doi.org/10.1038/sj.pcan.4500852 |
[9]
.
Adaptation to hypoxia is another defining characteristic of aggressive tumors. As proliferating cancer cells outgrow their blood supply, regions of low oxygen tension emerge, leading to stabilization of Hypoxia-inducible factor 1-alpha. This transcription factor activates genes involved in angiogenesis, glucose transport, and metabolic adaptation, allowing tumor cells to survive and thrive under adverse conditions. Hypoxia-driven pathways are also closely associated with treatment resistance, particularly to radiotherapy and certain chemotherapeutic agents, further linking biological aggressiveness to poor clinical outcomes.
Angiogenesis plays a complementary role by enabling tumors to expand beyond diffusion limits and facilitating metastatic spread. The newly formed vasculature, although often disorganized and inefficient, provides essential nutrients and oxygen while also contributing to an uneven microenvironment that fosters continued hypoxia and selection of more aggressive cell populations. This dynamic interplay between hypoxia, angiogenesis, and metabolism exemplifies how intrinsic tumor biology drives aggressiveness.
In clinical practice, aggressiveness is typically assessed using histopathological grading systems and molecular markers, whereas severity is evaluated through staging systems that describe the extent of disease dissemination. Severity encompasses not only tumor burden but also its physiological consequences, such as organ dysfunction and systemic complications. Increasingly, integration of molecular, metabolic, and microenvironmental indicators, such as glycolytic activity, hypoxia-associated signaling, and angiogenic profiles is enhancing the ability to distinguish between tumors that are biologically aggressive and those that are clinically severe. Understanding this distinction is critical for optimizing prognosis assessment and tailoring therapeutic strategies
| [10] | Stewart GD, Gray K, Pennington CJ, Edwards DR, Riddick AC, Ross JA, Habib FK. Analysis of hypoxia-associated gene expression in prostate cancer: lysyl oxidase and glucose transporter-1 expression correlate with Gleason score. Oncol Rep. 2008; 20: 1561–1567. |
[10]
.
Prostate cancer cells are highly adaptive and exhibit remarkable metabolic and phenotypic plasticity that enables survival under diverse and often hostile microenvironmental conditions. Unlike many tumors that rely predominantly on glycolysis, prostate cancer cells can efficiently reprogram their metabolism to utilize alternative energy sources such as lipids and amino acids, allowing them to persist even under low-glucose conditions.
In response to stressors such as hypoxia, nutrient deprivation, and therapeutic interventions, these cells activate key regulatory pathways, including AMPK signaling, autophagy, and androgen receptor–mediated mechanisms, to maintain energy balance and promote survival. This adaptive capacity not only supports continued proliferation but also facilitates the emergence of more aggressive and therapy-resistant phenotypes. Consequently, prostate cancer progression is driven not merely by uncontrolled growth but by a dynamic evolutionary process in which cells continuously adjust to environmental pressures, underscoring the importance of targeting adaptive mechanisms rather than single metabolic pathways in therapeutic strategies
.
The incidence of prostate cancer (PC) has risen annually. PC mortality is explained by the metastatic disease (mPC). There is an intermediate scenario in which patients have non-mPC but have initiated a metastatic cascade through epithelial-mesenchymal transition. There is indeed a need for more and better tools to predict which patients will progress in the future to non-localized clinical disease or already have micrometastatic disease and, therefore, will clinically progress after primary treatment. Biomarkers for the prediction of mPC are still under development; there are few studies and not much evidence of their usefulness
| [12] | San Francisco IF, Rojas PA, Bravo JC, Díaz J, Ebel L, Urrutia S, Prieto B, Cerda-Infante J. Can We Predict Prostate Cancer Metastasis Based on Biomarkers? Where Are We Now? Int J Mol Sci. 2023 Aug 7; 24(15): 12508.
https://doi.org/10.3390/ijms241512508 |
[12]
.
2. Methodology
Early detection of prostate cancer is critical for improving clinical outcomes because the disease often progresses silently, with few or no symptoms in its initial stages. When identified early, before the tumor has spread beyond the prostate, treatment options such as surgery or radiation therapy are significantly more effective and can lead to high survival rates. Early detection also enables better risk stratification, allowing clinicians to distinguish between indolent tumors that may require active surveillance and aggressive forms that demand immediate intervention. From a biological perspective, detecting the disease at an early stage reduces the likelihood that cancer cells have developed adaptive mechanisms, metastatic potential, or resistance to therapy. Consequently, timely screening and monitoring not only improve patient prognosis but also reduce the complexity and cost of treatment, making early detection a cornerstone of effective prostate cancer management.
In a 1D, Fokker–Planck model for prostate cancer, the latent disease state or a biomarker such as PSA can be expressed as:
(1)
where f(,t) denotes the deterministic drift component governing the average progression of disease over time, g(,t)g denotes the diffusion component accounting for stochastic variability and hidden heterogeneity, dt is an infinitesimal time increment, and is the increment of a standard Wiener process. A Wiener process is a stochastic process with the following properties:
1) Starts at zero: W0=0
2) Independent increments: Changes over non-overlapping time intervals are independent.
3) Gaussian increments:
4) Continuous but nowhere smooth: The path is continuous, but it is not differentiable (it looks jagged at every scale).
Wt can be viewed as: a random walk in continuous time, representing unpredictable fluctuations with no trend (mean = 0). The clinical meaning is that is what expected in the disease progression including treatment while represents random deviations from the expectation. The with corresponding Fokker–Planck equation
(2)
Here, f(x,t) is the drift term, meaning the average directional change of disease burden or PSA over time, and g(x,t) is the diffusion term, meaning the random variability caused by patient heterogeneity, measurement noise, treatment response variability, and unobserved biology. In prostate cancer modeling, PSA has often been used as a proxy variable, although reviews note that PSA alone is imperfect and that PSA doubling behavior can be more informative than absolute PSA by itself.
For prostate cancer, there is no single universal pair of functions and g . They depend on what state variable represents. If x(t) is PSA, then a simple and clinically interpretable starting point is
This says PSA tends to grow at intrinsic rate α, treatment u(t) reduces it with effectiveness β, and uncertainty scales with disease magnitude through multiplicative noise σx. That form is attractive because untreated growth, treatment suppression, and increasing variability in advanced disease are all represented compactly. Earlier stochastic PSA studies after radiotherapy modeled the time-dependent density of PSA and explicitly discussed treatment-related parameters and patient-specific sensitivity, which supports using drift as the biologic-treatment trend and diffusion as uncertainty/heterogeneity.
If x represents latent tumor burden rather than PSA directly, then a better choice is often
(3)
where r denotes the intrinsic tumor growth rate, K is the carrying capacity (carrying capacity K is the maximum tumor burden that the biological environment can sustain), u(t) represents treatment intensity over time, η is the treatment effectiveness coefficient, and σ characterizes stochastic variability arising from biological heterogeneity and unobserved factors. In this formulation, the drift term captures logistic tumor growth modulated by treatment effects, while the diffusion term reflects multiplicative noise, allowing variability to scale with disease burden. This representation is consistent with the biological understanding that both progression and uncertainty tend to increase as tumor burden grows. Substituting (
3) into (
2) yields:
(4)
where the first term describes deterministic tumor growth modulated by treatment, and the second term captures state-dependent stochastic variability in disease progression.
Example:
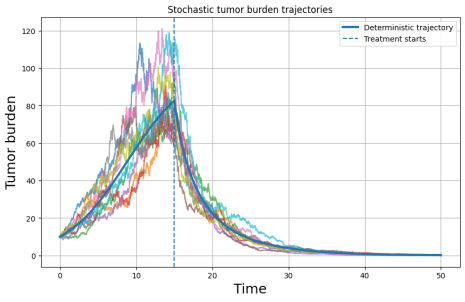
Figure 1 shows stochastic trajectories of latent tumor burden. Each colored curve represents an independent realization of the stochastic process governed by the equation:
illustrate variability in tumor evolution across hypothetical patients. The solid thick line denotes the corresponding deterministic trajectory obtained by setting the stochastic term to zero. Prior to treatment initiation (dashed vertical line at t=15), tumor burden increases approximately according to logistic growth. After treatment onset, the trajectories exhibit a pronounced decline due to the treatment effect term The spread among stochastic paths reflects intrinsic biological variability and uncertainty in disease progression, with larger dispersion observed at higher tumor burden levels due to multiplicative noise. This figure highlights how stochastic modeling captures heterogeneous progression patterns and demonstrates that individual trajectories may deviate substantially from the average deterministic trend.
Let us consider now the following example when
where
Z(t) is the latent tumor burden, PSA(t) is observed PSA, G is grade group, S is stage, and u(t) is treatment intensity. In this example, G and S are fixed patient characteristics, u(t) changes when treatment starts, Z(t) follows a stochastic differential equation and PSA is linked to latent burden through an observation model.
Figure 1 depicts stochastic tumor burden trajectories illustrating heterogeneous disease evolution and treatment response. The plot shows multiple simulated tumor burden trajectories (colored lines) generated using a stochastic modeling framework, capturing variability across a patient cohort. The solid blue curve represents the deterministic (average) trajectory, which smooths out individual fluctuations and fails to reflect underlying heterogeneity. Tumor burden increases over time due to disease progression until the initiation of treatment (indicated by the vertical dashed line), after which all trajectories exhibit a general declining trend, though with significant variability in peak magnitude, timing, and rate of response. This spread highlights the importance of modeling stochastic dynamics rather than relying on a single average pathway. The figure demonstrates how ensemble-based approaches, such as SAIHA or PM GenAI, provide a more realistic representation of system behavior by generating distributions of possible outcomes, enabling improved risk assessment, early detection of aggressive progression patterns, and more informed, personalized intervention strategies. Recent advances in computational medicine have led to the development of integrative frameworks such as Stochastic Artificial Intelligence Hybrid Architectures (SAIHA) and Precision Medicine Generative Artificial Intelligence (PM GenAI), which aim to combine mechanistic modeling, data-driven learning, and probabilistic reasoning for complex disease analysis. SAIHA frameworks integrate deterministic biological models with stochastic processes and machine learning components to capture both known physiological mechanisms and intrinsic variability across patients. Similarly, PM GenAI approaches leverage generative modeling techniques to reconstruct latent disease states, simulate patient-specific trajectories, and support predictive inference under uncertainty.
These frameworks are particularly relevant to prostate cancer, a disease characterized by significant biological heterogeneity, nonlinear progression dynamics, and incomplete observability through clinical biomarkers such as prostate-specific antigen (PSA). Traditional statistical models, including regression-based approaches and survival analysis, often fail to capture these complexities, as they rely on population-level assumptions and do not explicitly model latent disease evolution or uncertainty over time.
Figure 1. Stochastic trajectories of latent tumor burden under logistic growth with treatment intervention.
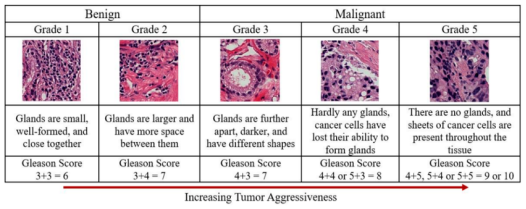
Figure 2 shows Histopathological grading of prostate cancer according to the Gleason scoring system and corresponding tumor aggressiveness
. The figure illustrates representative microscopic glandular architectures across Gleason Grade Groups 1 through 5, progressing from benign and well-differentiated tissue (left) to highly malignant and poorly differentiated tissue (right). In low-grade disease (Grade 1, Gleason score 3+3=6), glands are small, uniform, and closely packed, reflecting well-preserved normal structure. As grade increases (Grades 2–3, Gleason scores 3+4=7 and 4+3=7), glandular organization becomes increasingly irregular, with greater spacing, structural distortion, and darker cellular features, indicating intermediate aggressiveness.
In high-grade disease (Grades 4–5), glandular architecture is largely lost. Grade 4 tumors (Gleason score 4+4=8 or 5+3=8) show poorly formed or fused glands, while Grade 5 tumors (Gleason scores 4+5, 5+4, or 5+5=9–10) exhibit complete absence of gland formation, with sheets of undifferentiated cancer cells occupying the tissue. The arrow indicates increasing tumor aggressiveness from left to right, corresponding to loss of differentiation and structural organization.
This grading system provides a critical measure of tumor aggressiveness and is widely used in clinical decision-making. In the context of the present study, Gleason grade serves as a key parameter influencing the drift term in the stochastic model of tumor progression, with higher grades associated with accelerated growth dynamics and reduced treatment responsiveness.
Figure 2. Histopathological grading of prostate cancer.
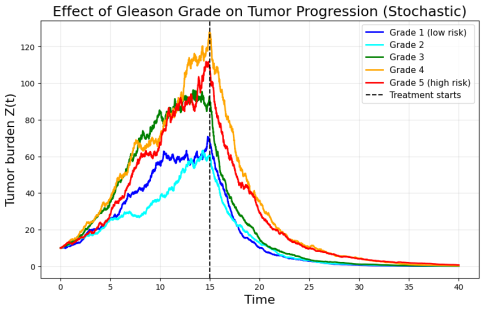
Figure 3 depicts the effect of Gleason grade on stochastic tumor progression and treatment response. The figure illustrates simulated tumor burden trajectories Z(t) for prostate cancer patients stratified by Gleason grade (Grades 1–5), reflecting increasing levels of clinical aggressiveness. Each curve represents a stochastic realization capturing the dynamic evolution of tumor burden over time under biological variability. Lower-grade tumors (Grades 1–2) exhibit slower growth, lower peak tumor burden, and more rapid decline following treatment, indicating less aggressive disease dynamics and better therapeutic response. In contrast, higher-grade tumors (Grades 4–5) demonstrate accelerated growth, higher peak burden prior to intervention, and a more prolonged decay phase, reflecting increased resistance and persistence.
The vertical dashed line marks the initiation of treatment, after which all trajectories show a downward trend, though with grade-dependent differences in response rates and residual burden. Notably, intermediate Grade 3 exhibits transitional behavior, highlighting the continuum between indolent and aggressive disease. This figure emphasizes that tumor progression is not adequately captured by a single deterministic trajectory; instead, stochastic modeling reveals clinically meaningful heterogeneity across risk groups. Such representations align with SAIHA (Stochastic Artificial Intelligence for Hazard Analysis) and PM GenAI (Principal model Generative Artificial Intelligence) frameworks, enabling probabilistic forecasting, improved risk stratification, and more personalized treatment planning based on underlying disease dynamics rather than average population behavior
.
Cancer stage is usually based on three components:
1) T (Tumor) → size and local extent of the primary tumor
2) N (Nodes) → whether cancer has spread to nearby lymph nodes
3) M (Metastasis) → whether cancer has spread to distant organs
Figure 3. Gleason grades and progression dynamics.
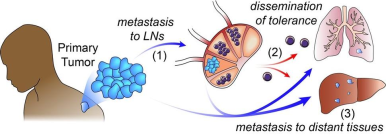
Figure 4 illustrates the multistep process of cancer dissemination. The primary tumor originates in the prostate (left), where malignant cells proliferate locally. In step (1), tumor cells invade surrounding tissue and enter the lymphatic system, leading to metastasis to regional lymph nodes (LNs).
Within the lymph nodes, cancer cells may adapt to the microenvironment and evade immune surveillance
| [14] | Vergis R, Corbishley CM, Norman AR, Bartlett J, Jhavar S, Borre M, Heeboll S, Horwich A, Huddart R, Khoo V. Intrinsic markers of tumor hypoxia and angiogenesis in localized prostate cancer and outcome of radical treatment: a retrospective analysis of two randomized radiotherapy trials and one surgical cohort study. Lancet Oncol. 2008; 9: 342–351. |
[14]
. In step (2), tumor cells disseminate from lymphatic or vascular pathways into the systemic circulation, reflecting the spread of cancer cells beyond the primary site. This process involves complex biological mechanisms, including immune tolerance, cellular plasticity, and interaction with the tumor microenvironment. In step (3), circulating tumor cells establish secondary tumors in distant organs such as the lungs, liver, and bone, which is a common metastatic site in prostate cancer.
Higher Gleason grades are associated with stronger progression dynamics in the deterministic component of the model; individual stochastic realizations may show partial overlap or temporary reversals due to random fluctuations
. Thus, Grade 5 is expected to exhibit greater progression on average, even if a single simulated Grade 4 trajectory occasionally exceeds a Grade 5 trajectory.
This stage represents advanced disease, characterized by widespread tumor burden and significantly reduced prognosis. The arrows indicate the directional progression from localized disease to systemic dissemination. This multistage process underlies the concept of cancer staging, where early stages correspond to localized tumors and advanced stages involve regional and distant metastases. In the context of the present study, disease stage reflects the extent of dissemination and directly influences the dynamics of tumor progression modeled through the latent-state framework.
Figure 4. Schematic representation of prostate cancer progression from primary tumor to metastatic disease.
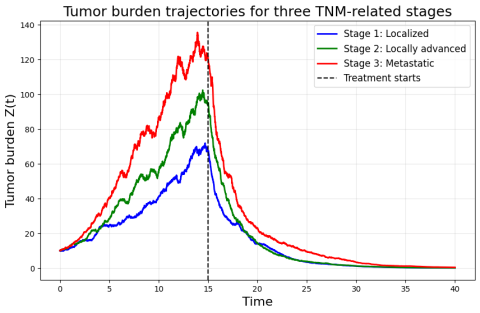
Figure 5 shows effects of tumor grade (G) and clinical stage (S) on stochastic tumor progression under treatment. It illustrates trajectories of latent tumor burden Z(t) governed by a stochastic differential equation with logistic growth, treatment suppression, and multiplicative noise. Each curve represents a representative realization for a patient profile with increasing disease severity: low grade/low stage (blue), medium grade/medium stage (green), and high grade/high stage (red). The vertical dashed line indicates the onset of treatment at t=15.
Figure 5. Stochastic tumor burden trajectories across three TNM-related stages of prostate cancer.
2.1. Latent Reconstruction of Prostate Cancer Severity
Prostate cancer progression is governed by complex biological processes that are only partially observable through clinical measurements such as prostate-specific antigen (PSA). While PSA remains a cornerstone biomarker, it often fails to accurately reflect the underlying tumor burden, particularly in heterogeneous patient populations and under treatment. In this study, we introduce a latent-state framework for reconstructing prostate cancer severity from observed clinical data. The proposed approach models disease progression as a stochastic process governed by a latent tumor burden, whose dynamics are inferred from noisy and incomplete observations.
By integrating clinical variables such as Gleason grade and disease stage with stochastic modeling techniques, including Fokker–Planck dynamics, the framework captures both deterministic progression and intrinsic variability. Numerical simulations demonstrate that latent reconstruction reveals clinically meaningful patterns of disease evolution that are not apparent from PSA alone. The results highlight the potential of latent-state approaches for improving risk stratification, early detection of progression, and personalized treatment planning in prostate cancer.
Prostate cancer is one of the most prevalent malignancies worldwide and remains a major challenge in clinical oncology. Disease monitoring and treatment decisions are largely guided by prostate-specific antigen (PSA), a biomarker that reflects tumor activity. However, PSA is an indirect and often imperfect measure of disease severity. In many cases, tumor progression may occur despite low or stable PSA levels, while treatment-induced changes in PSA may not correspond to actual changes in tumor burden.
This limitation reflects a fundamental issue: clinical observations provide only a partial and noisy projection of the underlying biological state. The true disease severity, defined by tumor burden, aggressiveness, and extent of spread is not directly observable. Instead, it must be inferred from available data, which are subject to variability, measurement error, and biological heterogeneity.
In previous work, we demonstrated that deterministic survival models such as Kaplan–Meier and Weibull approaches fail to capture the variability inherent in-patient trajectories. By introducing stochastic expansion techniques, we showed that survival outcomes are better represented as distributions rather than single curves, thereby accounting for heterogeneity and uncertainty. These findings motivate the need for models that explicitly incorporate latent disease states and stochastic dynamics.
We define prostate cancer severity through a latent variable Z(t), representing the underlying tumor burden. The observed PSA is treated as a noisy measurement of this latent state:
where ϵ(t) represents noise measurement and unobserved variability. The full patient state is represented as:
where G is the Gleason grade, S is the clinical stage, and u(t) represents treatment exposure. The latent tumor burden evolves according to a stochastic differential equation:
2.2. Inverse Problem Solution
We are solving an inverse problem:
given:
G, S, u(t), model parameters
The latent disease state Z(t) represents tumor severity and evolves according to stochastic dynamics. Observed PSA measurements provide indirect information about this latent state through a noisy observation model. Clinical variables, including tumor grade G and stage S, are treated as fixed covariates that modulate the progression dynamics via the drift term. Treatment exposure u(t) acts as a time-dependent control input. Model parameters govern growth, variability, and observation scaling, and are estimated from data. The latent reconstruction framework provides several important insights:
1) Decoupling observation from reality: PSA reflects only a projection of tumor burden and may underestimate true disease severity.
2) Role of grade and stage: Higher Gleason grade and advanced stage increase progression dynamics, even when PSA is similar.
3) Heterogeneity of progression: Patients with identical initial conditions may follow significantly different trajectories due to stochastic effects.
4) Treatment response variability: The same therapy may produce different outcomes depending on latent state and disease characteristics.
Simulation results demonstrate that higher-grade and higher-stage disease leads to faster progression, higher tumor burden, and reduced treatment responsiveness. These differences are not fully captured by PSA trajectories alone. That is why this is a latent reconstruction problem. If Z(t)evolves over time and depends on the previous state, we could set up a differential equation like:
Where the rate of change of Z(t) depends on PSA(t), G, S, and u(t). This type of model could represent a dynamic system where these variables influence the evolution of Z(t) over time. Now, to reconstruct Z(t) from the known variables (PSA, grade G, stage S, and u(t)), we need to invert the model.
Given the inverse problem structure, we would typically aim to minimize the error between the observed or expected Z(t) and the model’s prediction. Let’s assume we have some observations (the measured or target data for Z(t)):
where:
is the observed (or known) value of Z(t),
is a regularization parameter to control the complexity of the solution (useful to avoid overfitting),
The regularization term could be something like , which enforces smoothness of the reconstructed Z(t).
Let's make a practical example where we reconstruct Z(t) using Grade 4 (G = 4) and Stage 2 (S = 2) as inputs. We'll assume a simplified linear relationship for the reconstruction of Z(t) based on the given variables PSA(t), G, S, and u(t)u. The goal will be to estimate Z(t) from observed data using a linear regression model.
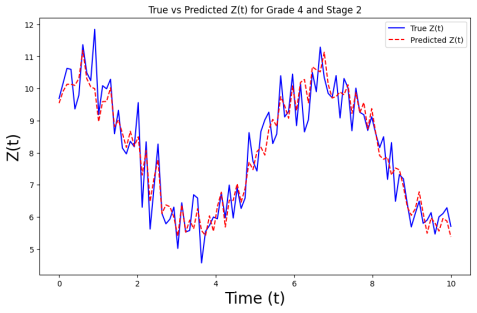
The figure shows the comparison between the true values (blue curve) and the predicted values (red dashed curve) of Z(t), which is reconstructed based on the given variables: Grade 4 (G = 4), Stage 2 (S = 2), PSA(t) (a time-dependent biomarker), and u(t) (a time-dependent control or intervention variable). The graph displays the results over a time range from t = 0 to t = 10.
The close alignment between the true and predicted values suggests that the linear regression model successfully estimates Z(t) from the provided input variables, even though some noise is present in the synthetic data. The small discrepancies observed between the true and predicted curves indicate the presence of noise and the model's effort to generalize from it.
Figure 6. Comparison between the true latent disease state Z (solid blue line) and the model-predicted latent state (red dashed line) over time for a representative patient profile with Gleason Grade Group 4 and clinical Stage 2 prostate cancer. The latent variable Z(t) represents the underlying tumor burden, which is not directly observable in clinical practice but is inferred through the proposed stochastic modeling framework using PSA levels and additional clinical covariates.
3. Discussion
In this study, we aimed to estimate and reconstruct the latent variable Z(t) from observed variables such as PSA(t), Grade (G), Stage (S), and u(t). We focused on using a linear regression model to explore how these variables interact and contribute to the estimation of Z(t). The primary method employed in this study was a linear regression model, which assumes a linear relationship between Z(t) and the observed variables PSA(t), G, S, and u(t). This approach was effective in providing a first approximation of Z(t), with reasonable performance based on the available data. The linear model allowed us to observe the relative contributions of PSA(t), Grade (G), Stage (S), and u(t) to Z(t), offering clear interpretability in terms of the model coefficients.
While the linear regression model proved to be useful in capturing the relationships between the observed variables and the latent variable Z(t), its assumptions of linearity present a limitation. In real-world applications, especially in medical and biological contexts, the relationships between variables are often more complex and non-linear. This means that while the linear regression model can serve as an initial model, it may not fully capture the underlying dynamics when the data relationships are non-linear or more intricate.
Despite the limitations, linear regression offers a number of advantages. First, it is simple to implement, interpret, and computationally efficient, making it a good choice for modeling relationships when the underlying structure is relatively straightforward. In this study, the linear regression model helped identify how each of the observed variables (PSA(t), G, S, and u(t)) influenced the reconstructed Z(t), providing insights into the importance of each factor.
The transparency of the model's coefficients also made it easier to understand the relative contribution of each input variable. For instance, we were able to quantify how Grade (G) and Stage (S) affected Z(t), as well as how PSA(t) and u(t) contributed to its variation over time. These insights are valuable in contexts where interpretability and explainability are crucial, such as in clinical decision-making.
Although the linear regression model was a useful tool in this context, it has notable limitations. The assumption of linearity may not be appropriate for more complex data, and in cases where interactions between the variables are non-linear, the model could produce biased or suboptimal estimates of Z(t). In real-world datasets, especially those from clinical settings, the relationships between variables are often influenced by factors that are not captured by simple linear models.
Additionally, linear regression may not adequately handle interactions between the variables without further model specification. For example, if the effect of PSA(t) on Z(t) is not constant across different stages (S) or grades (G), a more advanced model might be needed to better capture such interactions.
Furthermore, in situations where the data contains noise, outliers, or missing values, linear regression may be sensitive to these issues. While standard regression techniques are robust to certain types of noise, more sophisticated methods such as regularization or other machine learning approaches might be necessary to improve model accuracy and generalizability in real-world applications.
In addition to the well-known limitations of linear regression models, namely their inability to capture nonlinear dynamics, temporal dependencies, and stochastic variability, the present results highlight the advantages of the proposed stochastic framework for assessing prostate cancer progression. Unlike regression-based approaches that provide static, population-level estimates, the model developed in this study enables dynamic, patient-specific tracking of disease evolution through a latent state representation. This allows for a more realistic characterization of tumor progression as a time-dependent and probabilistic process, which is essential for capturing the heterogeneity observed in clinical populations.
A key implication of this work concerns the limitations of prostate-specific antigen (PSA) as a sole biomarker. As demonstrated in both prior studies and our simulation results, PSA levels do not always reliably reflect the underlying tumor burden, particularly in cases where disease progression occurs despite relatively low or stable PSA values. The proposed model addresses this limitation by integrating PSA with additional clinical variables and embedding them within a latent-state framework, thereby providing a more comprehensive and biologically meaningful representation of disease status.
Furthermore, the results support the clinically established association between Gleason score and tumor aggressiveness. Higher Gleason grade groups were consistently associated with more rapid increases in the latent disease state Z(t), indicating more aggressive progression dynamics. This correlation, as reproduced by the model, reinforces its biological plausibility and clinical relevance. By explicitly incorporating Gleason grade alongside disease stage and treatment exposure, the framework captures key determinants of progression that are not adequately represented in simpler models.
Overall, these findings suggest that the proposed approach offers a powerful tool for assessing prostate cancer progression, with potential applications in risk stratification, treatment planning, and longitudinal patient monitoring. By moving beyond single-marker analysis and deterministic assumptions, the model provides a pathway toward more accurate and personalized clinical decision-making under uncertainty.